


Welcome to the world of GIS data visualization, where information is collected, combed, and displayed in one place for max collaboration and better decision-making.
The data is there—but what is the client going to do with it? Who’s going to see it? How do we make the most of it?
GeoVerra’s National Manager of GIS and in-house client portal champion, Cindy Genkin, answers these questions constantly. Using a geographic information system (GIS) that creates, manages, analyzes, and maps all types of data—then crafting it into one seamless, tailored web portal—she helps make data more accessible to GeoVerra clients than ever before.
“A lot of what we do is big infrastructure or transportation projects, which includes the client, consultants, and multiple stakeholders,” says Genkin. “We put information into one place so everyone can collaborate.”
Cut the Cookie Cutter
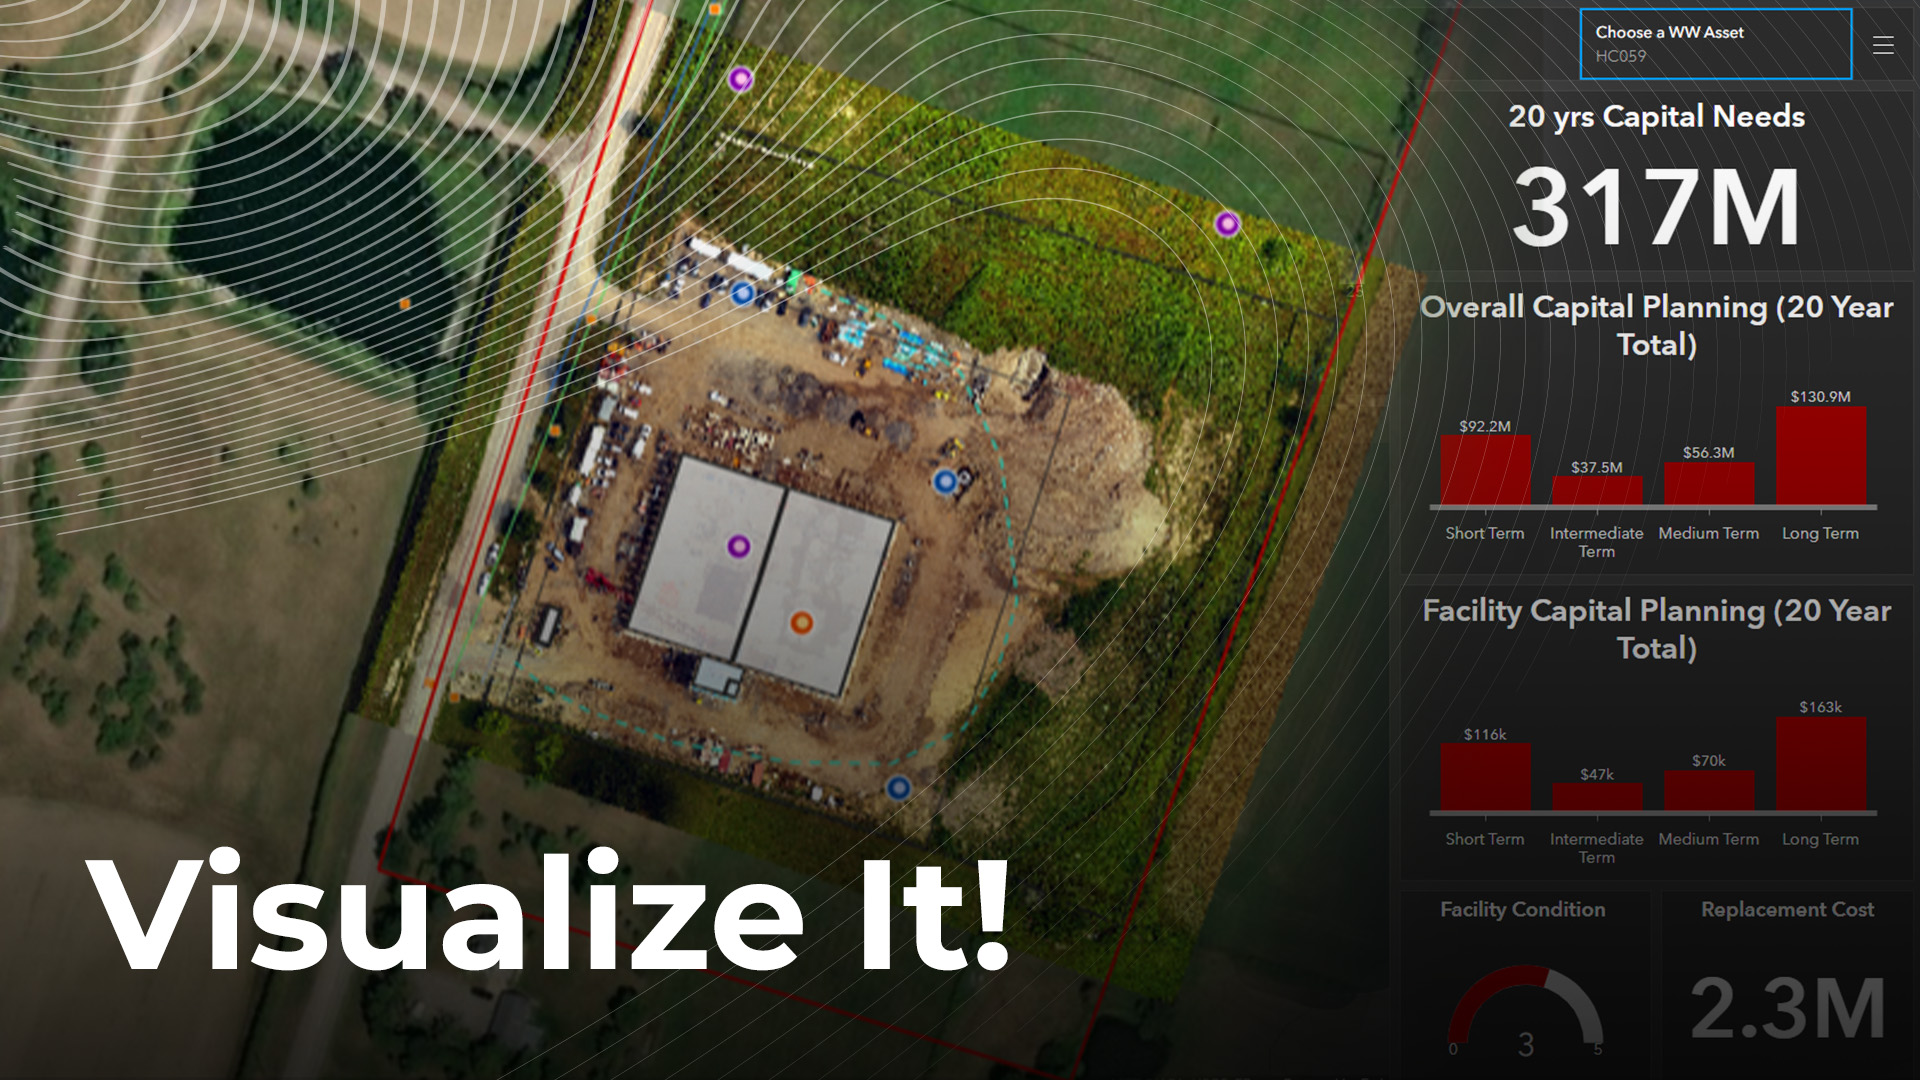
These portals are powerful and meaningful, allowing clients to analyze massive amounts of information and make data-driven decisions for nearly every industry imaginable. “Every portal is unique to our client, shaped to suit their goals,” explains Genkin. “That can include supplemental dashboards, still images, 360 panoramic images, 3D models, documents, precise maps, and so much more.”
By understanding, integrating, and delivering data in an intuitive, visual way, teams can gain more insights, drive smarter operations, and ultimately, deliver a safer and more sustainable project and business.
The COVID Driver
Geomatics has always been ahead of the game in leveraging technology, but for years, it was only larger infrastructure projects with big budgets that could afford to pull information together in this way—until COVID.
“In the last two years, this interest has trickled down to every type of project,” says Genkin. “If there’s any element of dispersion, no matter the industry, clients want to be able to connect online.” With people at home and major site restrictions, GeoVerra collected data and made sure everyone could see it—without anyone ever stepping foot on site.
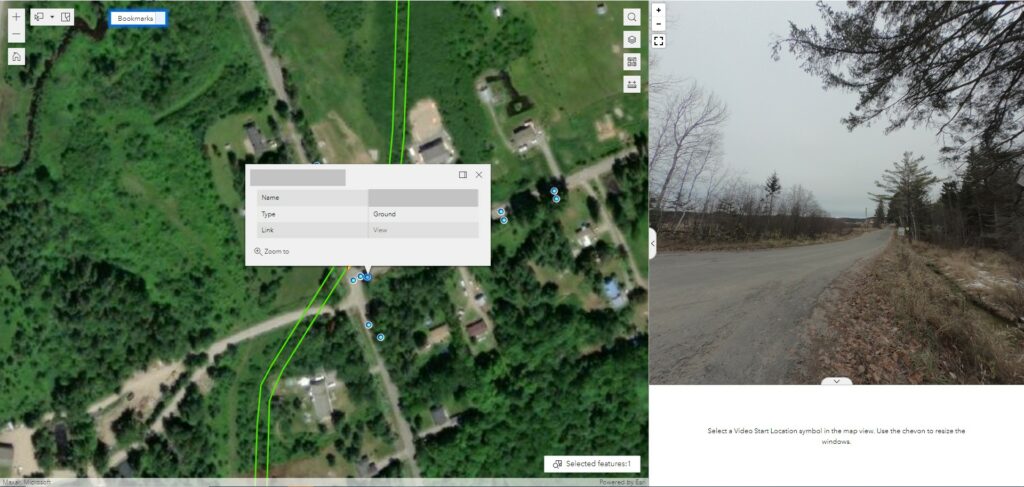
“A perfect example is construction monitoring. Every so often we’d scan the site with panoramic images. People could go in and see exactly what was happening, then compare it to the design files to ensure everything was on target. To think that was only ever done in person… it’s opened up everyone’s eyes.”
The oil and gas sector is showing major interest in these capabilities too. “They do a lot of field work and realize it’s not necessary for every person to physically visit every site,” says Genkin. This means fewer boots on the ground, mitigating safety risks and decreasing labour costs – a win-win situation for the service provider and the client.
Real Life Results
GeoVerra’s role also helps prevent costly mistakes. “One client had a utility relocation to do, but didn’t have the easements,” remembers Genkin. “If we hadn’t noticed as early as we did, that could’ve caused major delays. That part is so gratifying.”
Another memorable project for Genkin was an environmental agency that had collected a decade’s worth of lake contamination research. “They had never visualized it, never mapped it. We put together a comprehensive portal, and then they were able to show all their hard work and make an impact.”
When GeoVerra gets involved in a project early enough, they can help clients organize the data they have, identify what’s missing, and design a way for the entire team to collaborate. “It’s about creating one place where you can go and get an answer, without having to wait three hours for the person who knows that answer,” says Genkin.
It’s hard to attach a dollar amount to time saved with so many factors at play, but Genkin recalls gathering and displaying data from many different sites for one client. “They said they saved $50,000 in one month!”
The GeoVerra Edge
The sky’s the limit when it comes to improving productivity, communication, collaboration, risk, and safety. “We ensure everyone has the information they need before they go in the field, before they dig that hole,” says Genkin. “Other companies simply don’t have the people with the kind of experience and knowledge we do to filter the data and make it useful, to make it meaningful. That’s our edge.”
Now that’s technology with a human touch.
For more information on how you can benefit from data visualization for your next project, contact us today: www.geoverra.com


