
Canadians are the world’s second largest per capita users of water, with an average household use of up to 329 litres per person, per day. As of 2009, 86 per cent of Canadian households receive their water from a municipal water supply that undergoes some degree of treatment before being used and returned to the water system.
Recent studies show that thousands of kilometres of underground pipes that move water from treatment plants to taps are leaking: anywhere from 13 per cent to 30 per cent. At the same time, wastewater and storm water systems are rapidly aging, allowing pollutants to flow into rivers, lakes, and oceans. At a local level, municipalities often lack the financial and human resources required to improve and maintain their current systems.
To speed up the rate at which these assets are repaired—and even identify emerging issues before they occur—two Canadian municipalities developed a web-based common operating picture of their underground network. Vast amounts of information about asset condition and maintenance-related activities can now be managed and tracked, allowing asset managers to forecast future requirements for capital planning.

A window into underground infrastructure
Halifax Water manages 15 wastewater treatment facilities, 193 pumping stations and more than 3,600 kilometres of pipe. To improve asset management across the organization, the utility created a web-based dashboard that provides access to data on the entire underground infrastructure for over 120 staff members.
Geographic Information System (GIS) technology was used to intersect, analyze, map and visualize reams of surface and subsurface data. Using query functionality, staff can now look up specific features and attributes for pipe networks, water, wastewater and storm water assets along with service boundaries, pressure zones, meter zones, and aerial photography.
Field staff can access the dashboard through their mobile devices to retrieve critical infrastructure information, such as location and attributes including size, material, and age. Specialized tools such as the route calculator can calculate the quickest way to a specific location. Draw and measure tools allow staff to record their field work more accurately onsite.
“We’ve essentially unlocked a wealth of data resources,” says Harold MacNeil, manager, engineering information, Halifax Water. “Through a web-based environment, we’re able to open our subsurface infrastructure data to almost anyone across the organization while maintaining low costs and overhead.”
Creating a common operating picture of assets has also helped resolve infrastructure issues faster. When a resident calls with a drainage concern, for instance, staff can assess the situation from their desktop using the address query feature. A contours tool can be used to determine the degree of slope in the area and the surrounding greenery can be observed through aerial photos. The user can then begin to get a better feel for the situation and determine options of how the issue should be addressed.
To further promote access to data across the organization, Halifax Water implemented a form-based environment that allows data to be searched using custom-built templates. Staff can pull up attribute information for a specific asset including location, size, and material type along with corresponding as-built drawings and sketches. Users can also draw a polygon or rectangle on a map to search for assets by geographic location.
Field staff use the forms onsite to make edits directly to data stored within the corporate geodatabase, which are then immediately reflected through the dashboard. The web-based forms have replaced atlas books that were produced annually and would quickly become outdated.
“Asset data that used to take more than six months to update is now updated on a weekly basis,” says MacNeil. “In a growing city, this positions us to replace aging and damaged pipes more effectively while proactively identifying and managing risks and associated costs before they occur.”
Engineers use the forms to conduct condition assessments on pipes, valves, and pumping stations while monitoring flow, pressure, and capacity. This enables staff to detect and mitigate potential issues such as a pipe leak before they escalate. Once asset conditions are established, maps can be generated to communicate information, such as the risk associated to assets, with key stakeholders.
Meeting growing needs on Canada’s West Coast
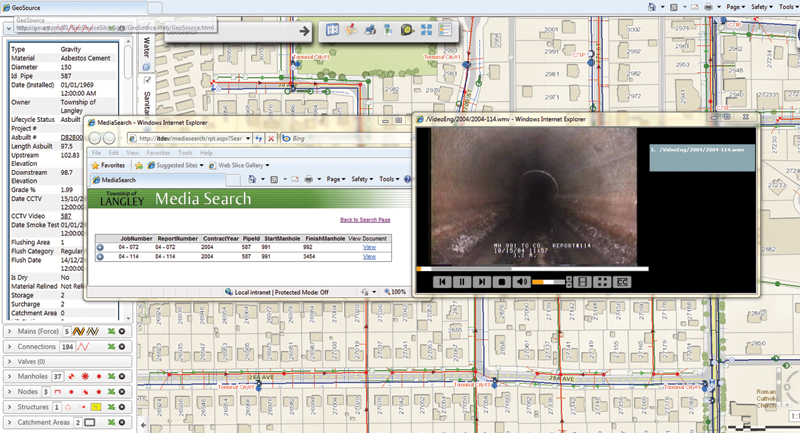
One of the fastest growing municipalities in British Columbia, the Township of Langley is expected to double its population in the next 30 years. To keep up with growing demands, the municipality implemented GeoSource, a web-based interactive mapping system that provides staff and the public with access to maps, land data, and aerial photography of the Township.
Leveraged by work crews, maintenance, construction and all other operational staff, users can see directly inside individual pipes and access associated as-built drawings. Pipes are tagged with ID numbers so that assets can be easily searched.
Engineers used to search a proprietary database to locate recordings of the Township’s sewer pipes and manually find the disk or tape media to view the footage, which could create costly delays in asset maintenance. Now, they can search CCTV inspection videos, photos, and documents related to underground infrastructure to plan timely maintenance schedules and respond to request for repairs.
GIS data is also fed into the Township’s asset management system to run models on pipe performance, test valve pressure, and monitor capacity flow. Potential urban development trends can also be factored in to predict how needs may change over time.
Derik Woo, geomatics manager for the Township of Langley, says, “Maintaining centrally stored, accurate GIS-based data not only allows us to forecast future needs and test existing infrastructure, it also supplies us with the information we need to ensure ongoing PSAB compliance today and well into the future.”
Having a clear, up-to-date and complete picture of underground assets allows municipalities to take a more proactive approach towards infrastructure maintenance and planning. GIS technology makes this possible by providing the platform for various asset data to be integrated and analyzed as web-based maps. It provides cost-effective access to accurate, consistent data as well as easy-to-use analytical tools that help users from different departments, including engineering, planning, and finance, collaborate together and conduct their work in a more efficient method.
Karen Stewart is the public works industry manager for Esri Canada.